Templates
Choose your templates
echo
hurricane
ravage
hook
razor
havoc
dagger
shuriken
raze
exort
viper
Color Schemes
Choose your color schemes
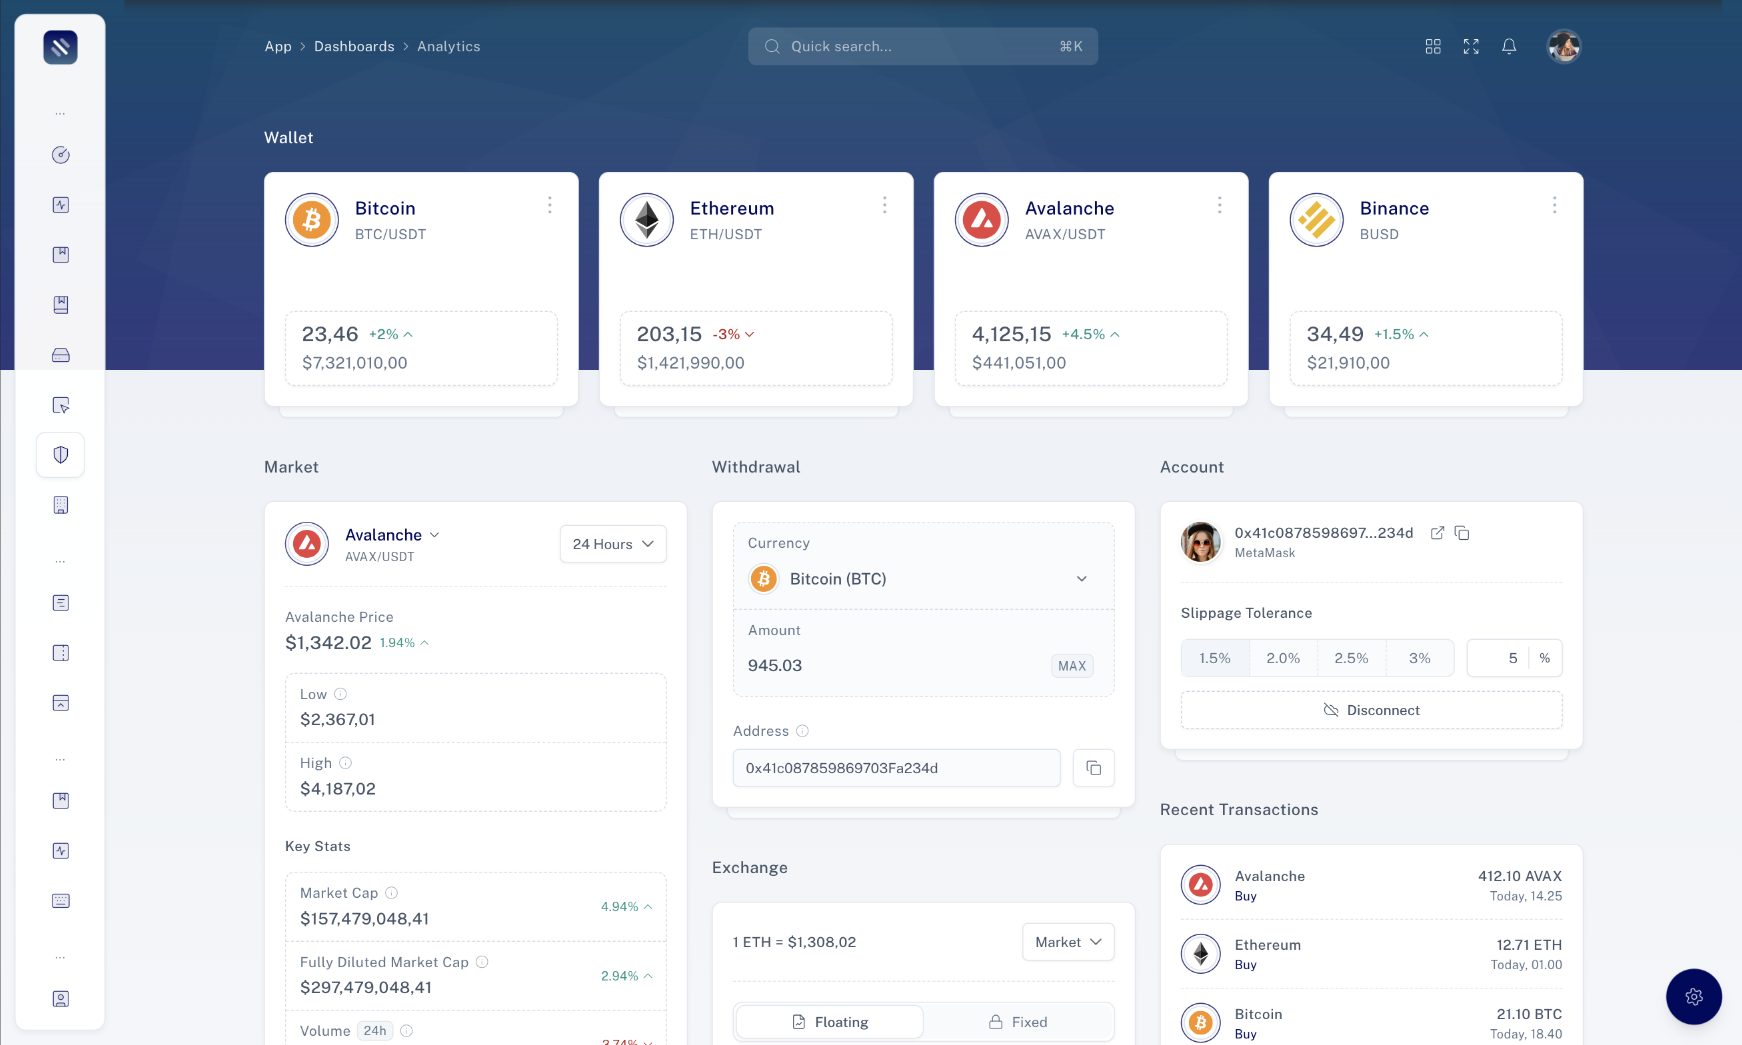
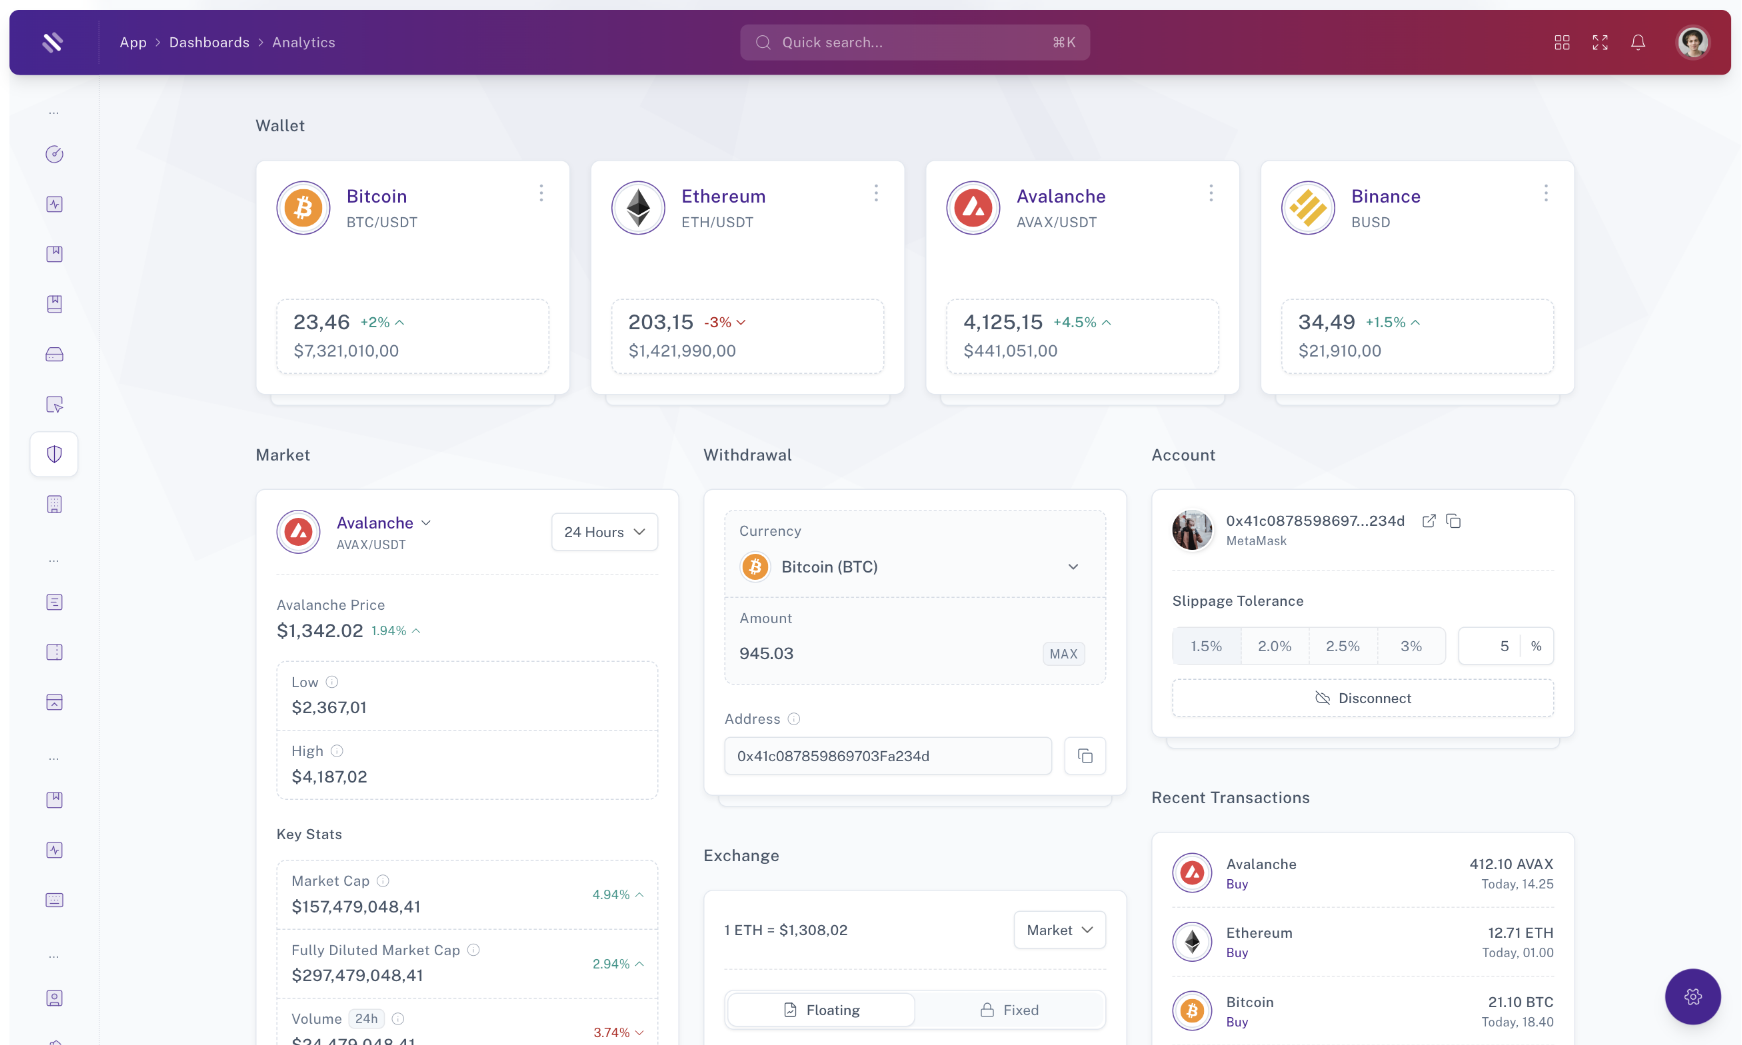
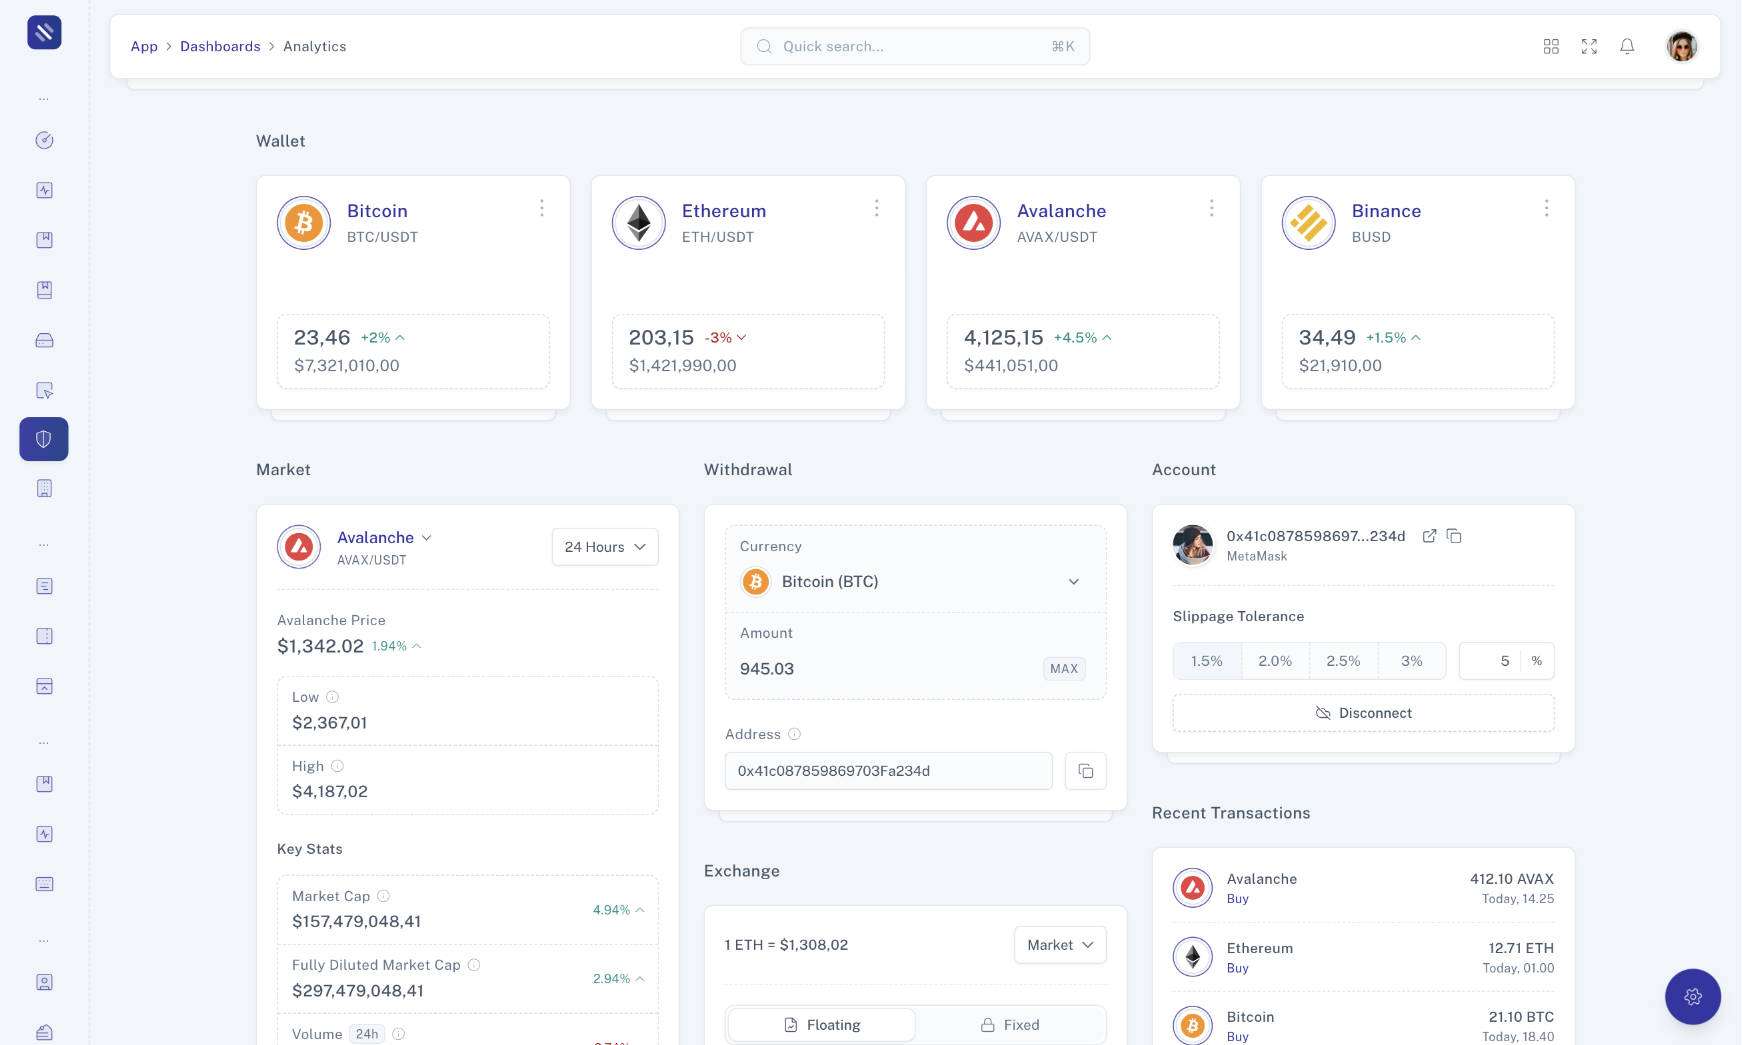
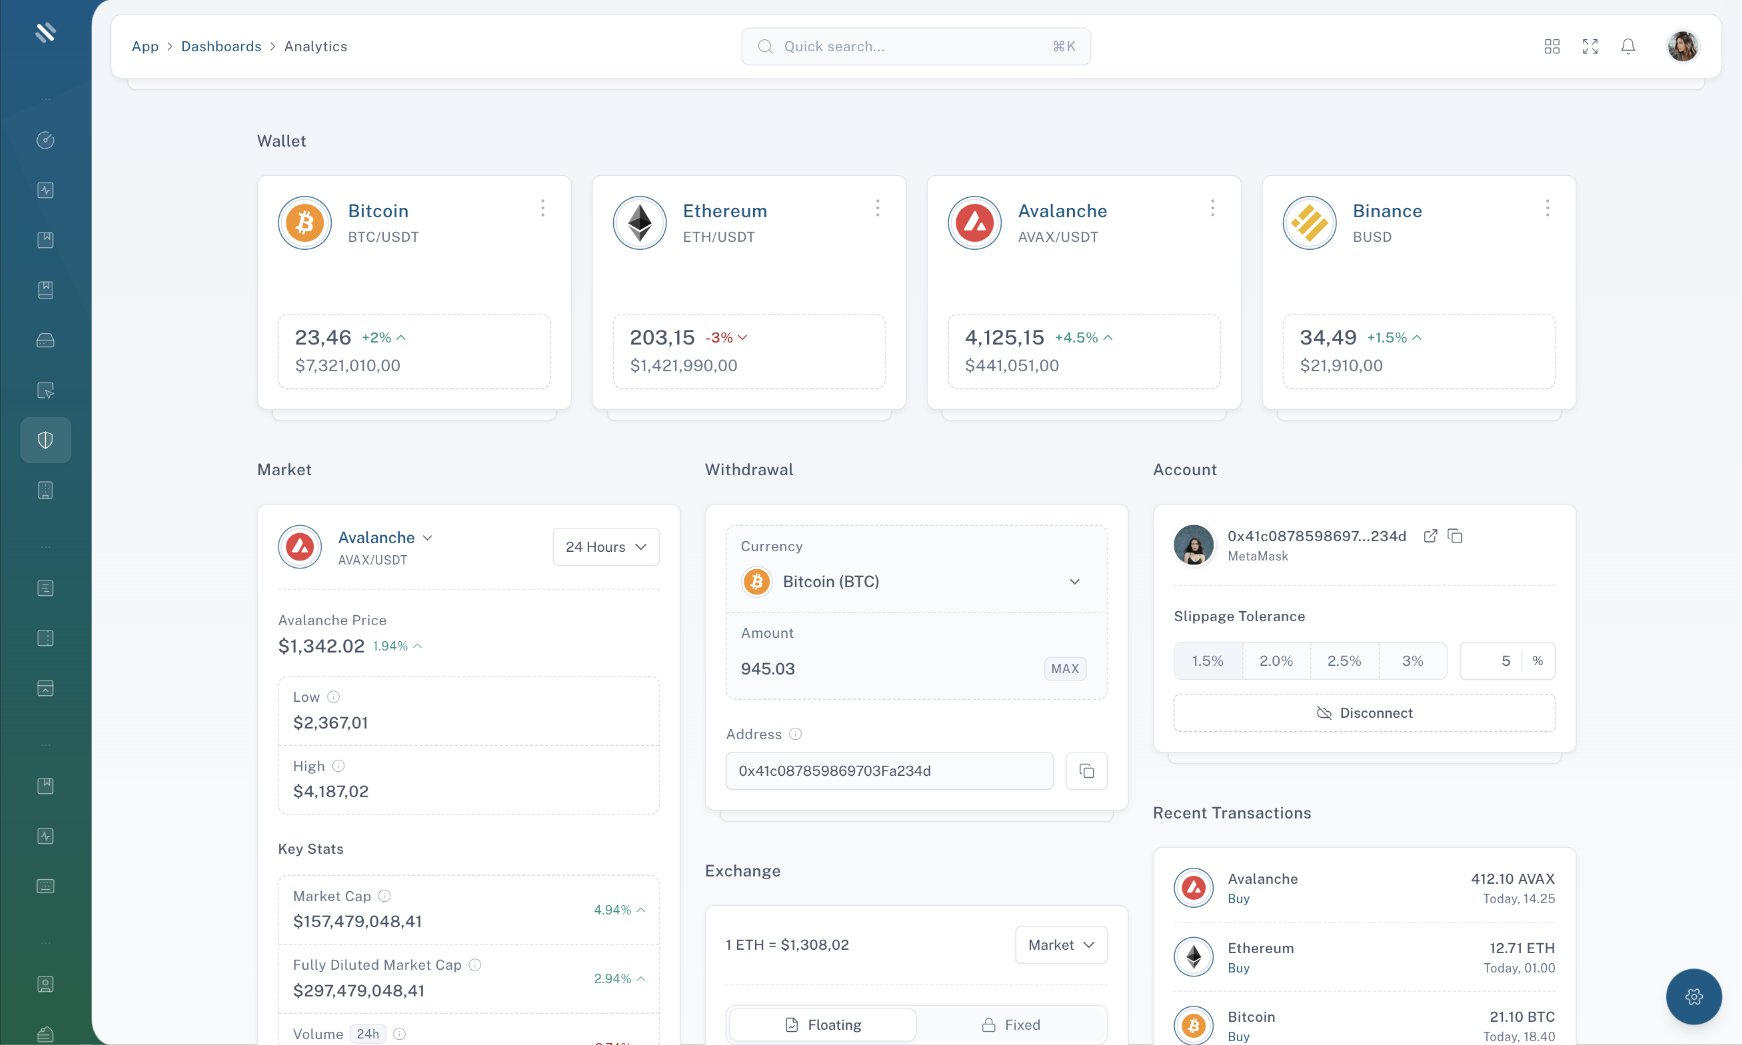
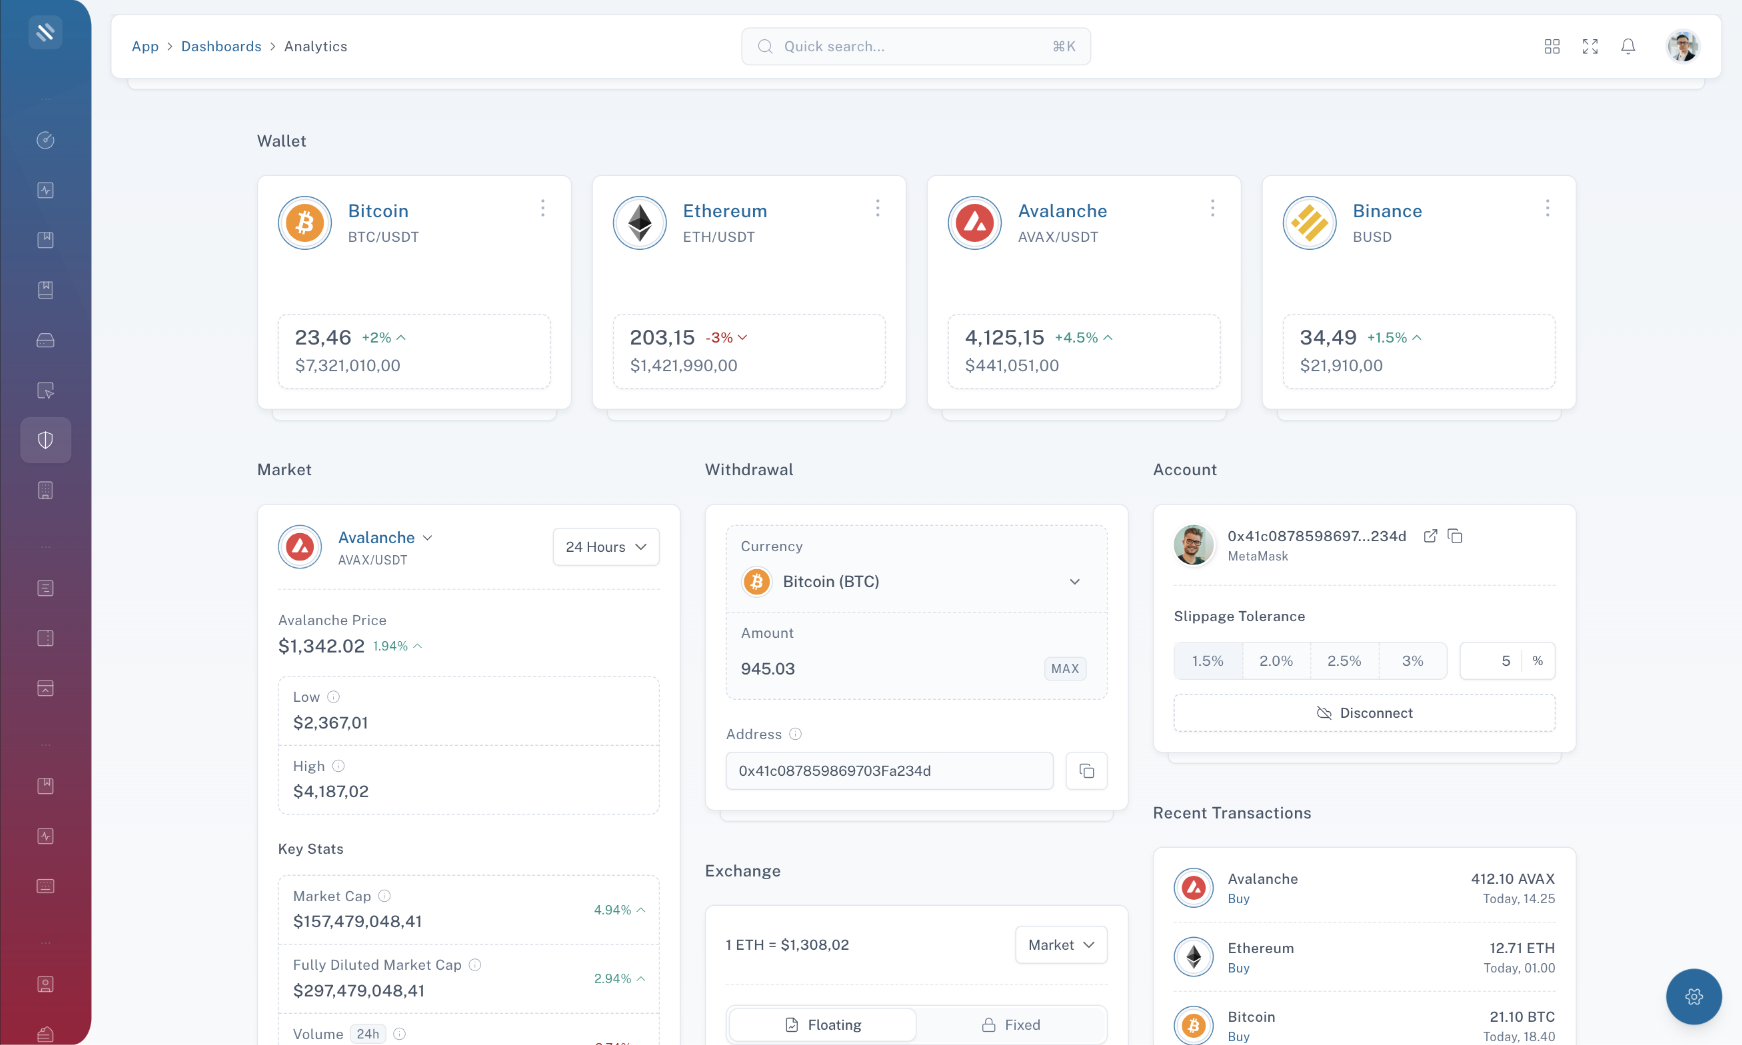
HAVOC
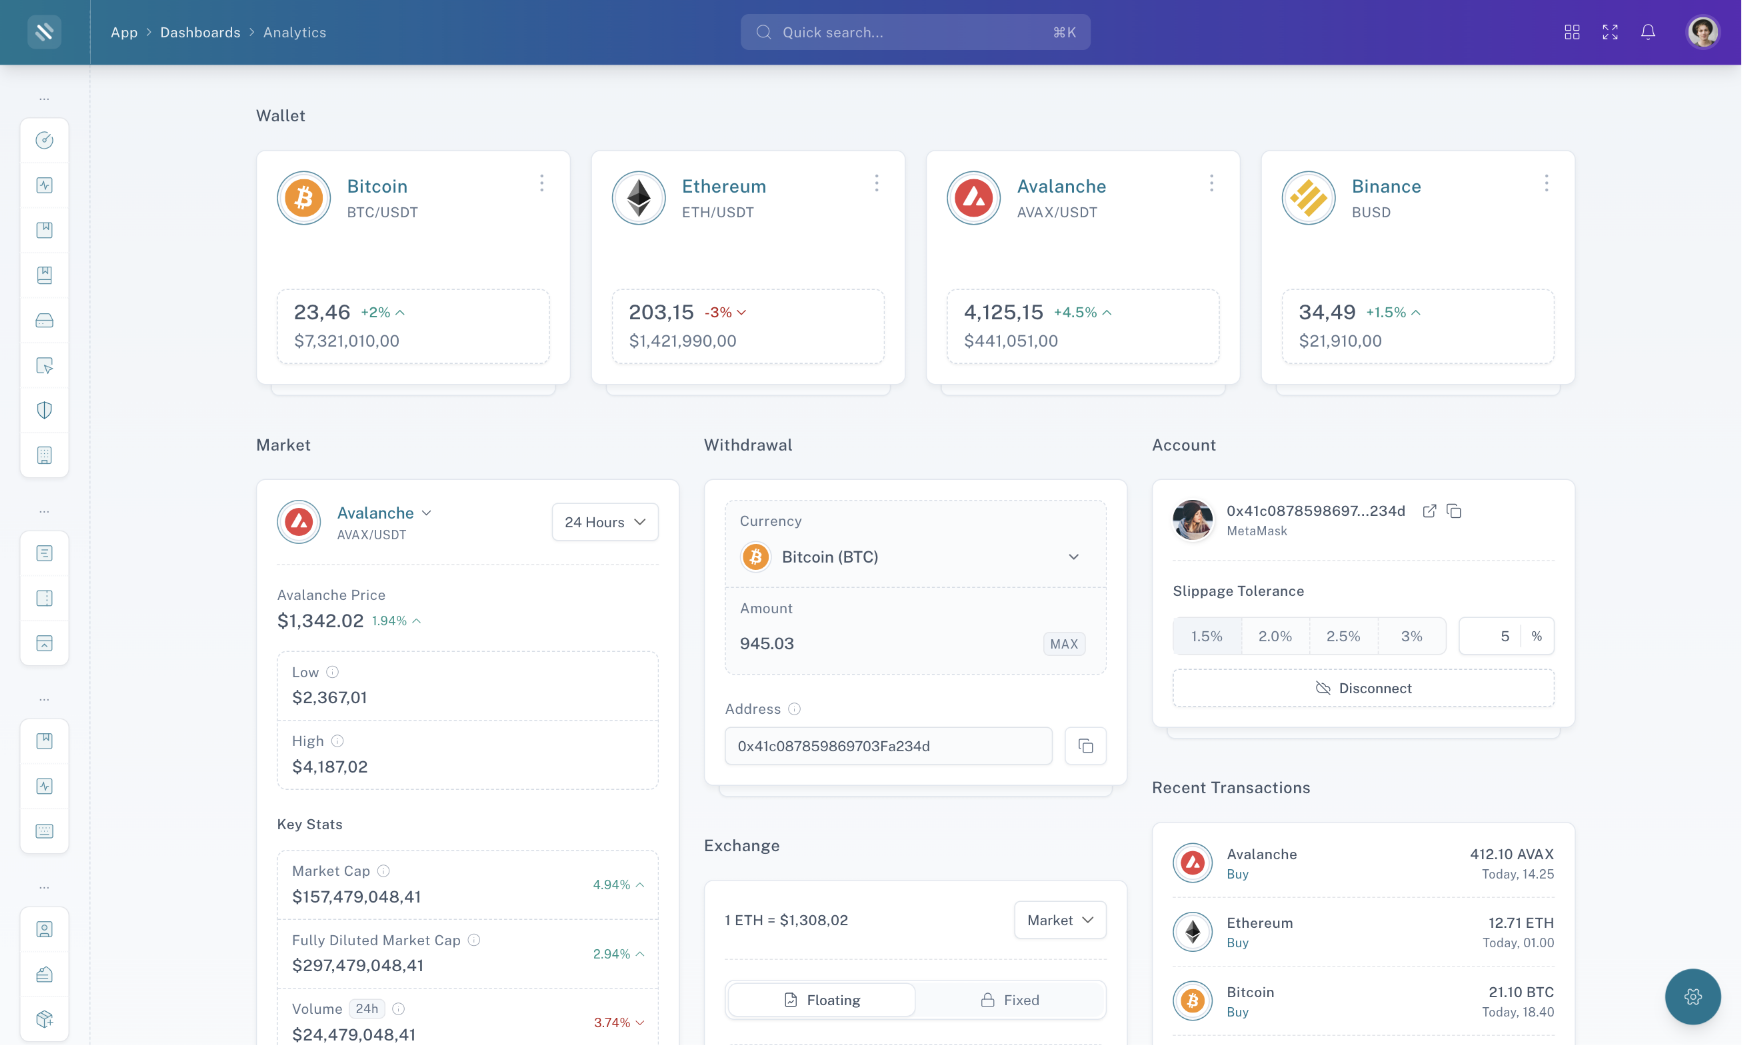
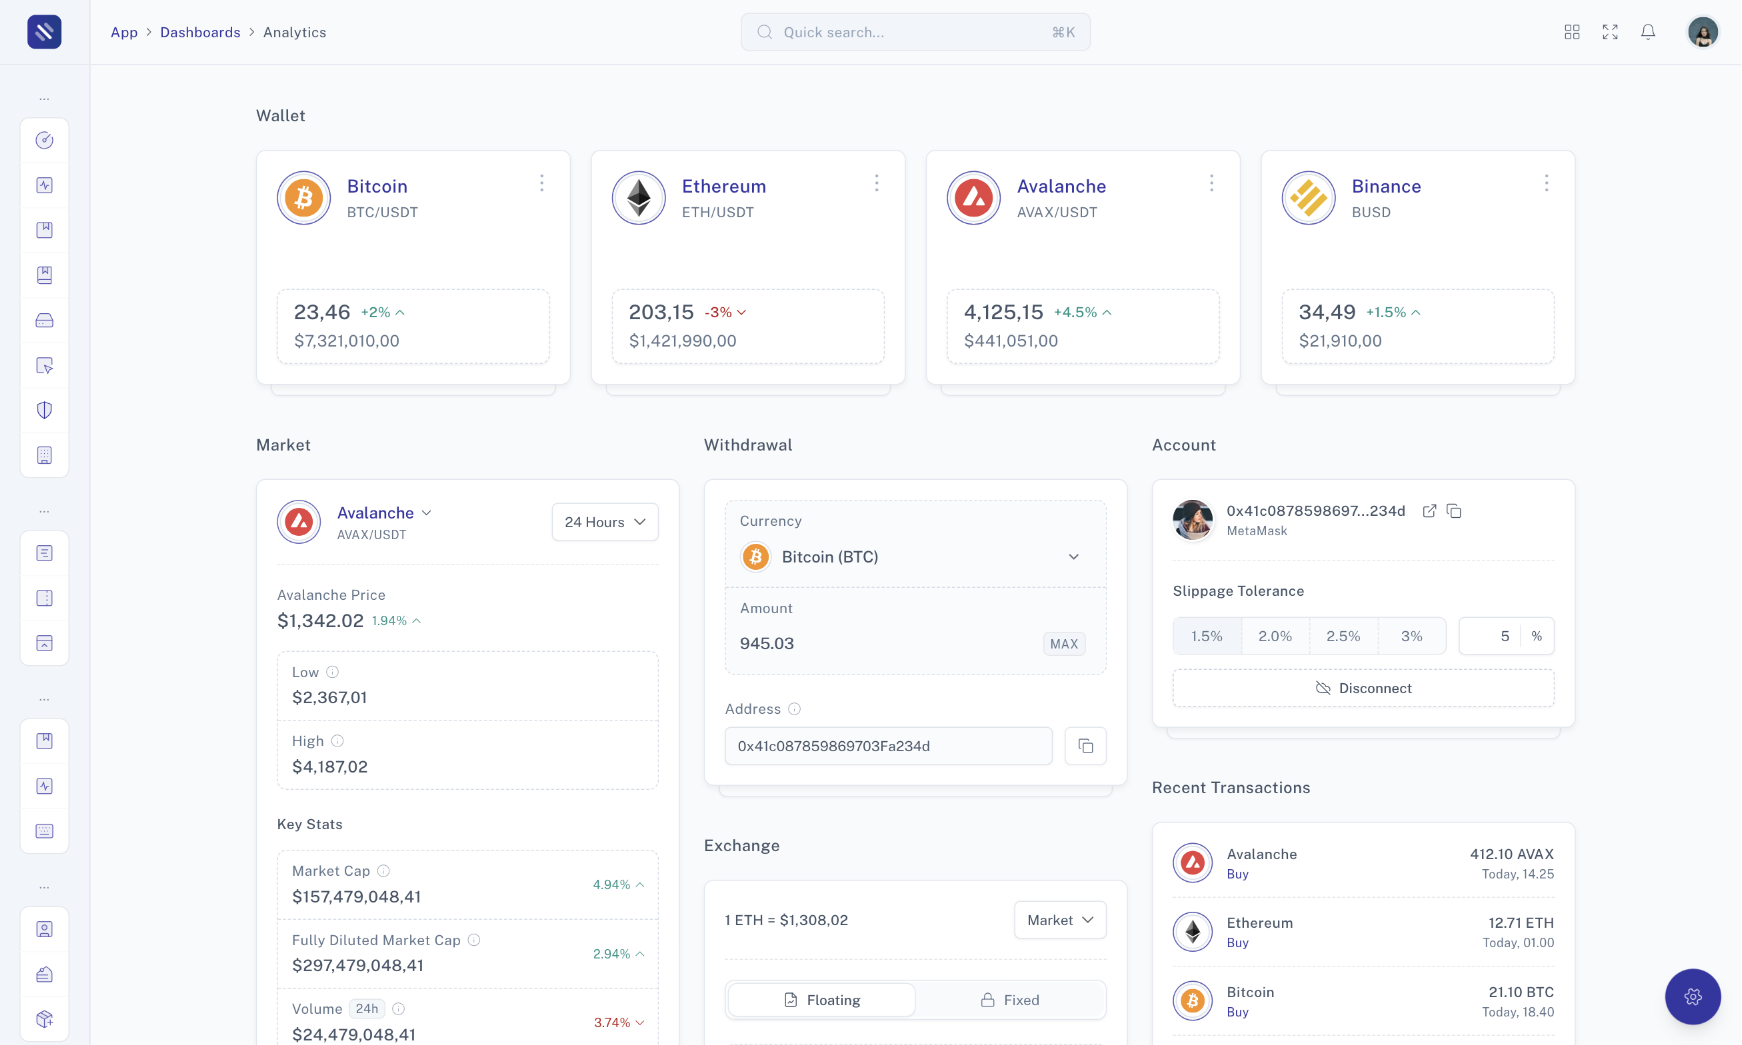
App
Dashboards
Analytics
Quick search...
⌘K
ESC
No result found
No results found for
. Please try a different search term or check your spelling.
Start your search here...
Users
Departments
Products
Mails
More
Locations
Projects
Devices
Users
See All
Cate Blanchett
Houston, USA
Brad Pitt
Seattle, USA
Jennifer Lawrence
Miami, USA
Departments
See All
Product Management
El Salvador
Operations
Heard Island and McDonald Islands
Customer Support
Saudi Arabia
Products
See All
Professional DSLR Camera
Electronics
High-Performance Laptop
Beauty & Personal Care
Wireless Earbuds with Mic
Books
Switch Account
Connected Services
Email Settings
Reset Password
Profile Info
Logout
Latest Activities
Added a new contact
Added a new contact, Sarah
Success
spreadsheet.xlsx
3.4MB
Copy Link
Delete
Wed May 2020
Task completed: Review Project Proposal
Reviewed and provided feedback
Completed
Sun Sep 2020
Uploaded audio recordings
Recorded podcast episodes
Completed
audio1.mp3
4.8MB
Copy Link
Delete
audio2.wav
6.2MB
Copy Link
Delete
Tue Apr 2020
Uploaded presentations
Added slides for the team meeting
Completed
presentation1.pptx
5.2MB
Copy Link
Delete
presentation2.ppt
4.5MB
Copy Link
Delete
Sat Dec 2022
Logged out
Signed out from the dashboard
Info
Tue Apr 2022
Notifications
Mark all as read
Uploaded images
Added project screenshots
Fri Dec 2020
Received 5 new emails
Inbox updates
Thu Dec 2021
Updated profile picture
Changed profile photo
Thu Apr 2022
Uploaded documents
Uploaded important project documents
Sat Apr 2022
Posted a status update
Shared thoughts on the project
Thu Sep 2022
Uploaded code files
Added new code modules
Tue Feb 2022
Added a new contact
Added a new contact, Sarah
Thu Mar 2021
Uploaded audio recordings
Recorded podcast episodes
Sun Dec 2020
Logged in successfully
Accessed the dashboard
Fri Aug 2020
Logged out
Signed out from the dashboard
Wed Jun 2020
Received a friend request
Friend request from John
Tue May 2020
Task completed: Review Project Proposal
Reviewed and provided feedback
Fri Sep 2020
Uploaded a spreadsheet
Added financial data for Q3
Fri Feb 2021
Uploaded presentations
Added slides for the team meeting
Tue Aug 2022
Uploaded video files
Shared video tutorials
Fri Jul 2020
Switch Account
Meryl Streep
meryl.streep@left4code.com
Brad Pitt
brad.pitt@left4code.com
Tom Hanks
tom.hanks@left4code.com
Johnny Depp
johnny.depp@left4code.com
Leonardo DiCaprio
leonardo.dicaprio@left4code.com
Login into an Existing Account
DASHBOARDS
E-Commerce
CRM
Hospital
Factory
Banking
Cafe
Crypto
Hotel
APPS
Inbox
4
File Manager List
File Manager Grid
Point of Sale
Chat
Calendar
UI WIDGETS
Creative
Dynamic
Interactive
USER MANAGEMENT
Users
Departments
Add User
PERSONAL DASHBOARD
Profile Overview
Events
Achievements
Contacts
Default
GENERAL SETTINGS
Profile Info
Email Settings
Security
Preferences
Two-factor Authentication
Device History
Notification Settings
Connected Services
Social Media Links
Account Deactivation
ACCOUNT
Billing
Invoice
E-COMMERCE
Categories
Add Product
Products
Product List
Product Grid
Transactions
Transaction List
Transaction Detail
Sellers
Seller List
Seller Detail
Reviews
AUTHENTICATIONS
Login
Register
COMPONENTS
Table
Regular Table
Tabulator
Overlay
Modal
Slide Over
Notification
Tab
Accordion
Button
Alert
Progress Bar
Tooltip
Dropdown
Typography
Icon
Loading Icon
Regular Form
Datepicker
Tom Select
File Upload
Wysiwyg Editor
Validation
Chart
Slider
Image Zoom
Hotel Performance Insights
Total Revenue
$92,464.00
12%
The total revenue generated from room bookings and hotel services.
Show full reports
Custom Date
Daily
Weekly
Monthly
Yearly
6,232
-2%
Weekly Arrivals
7,810
15%
Daily Check-Ins
4,135
-5%
Room Type Distribution - Standard
9,122
20%
Special Requests Fulfilled
6,232
-2%
Weekly Arrivals
7,810
15%
Daily Check-Ins
4,135
-5%
Room Type Distribution - Standard
9,122
20%
Special Requests Fulfilled
6,232
-2%
Weekly Arrivals
7,810
15%
Daily Check-Ins
4,135
-5%
Room Type Distribution - Standard
9,122
20%
Special Requests Fulfilled
Occupancy vs. Revenue
Occupancy Rate Over Time
78.5%
4%
Copy Link
Delete
Revenue Trends
$452,300
8%
Copy Link
Delete
Activity Stream
481,421
4%
Recent Hotel Activities.
24 Hours
48 Hours
64 Hours
Room 101
Guest checked in at 2:00 PM.
Standard
Room 118
Guest checked out at 11:30 AM.
Standard
Room 312
Guest requested extra towels.
Suite
Room 303
Room service order for breakfast.
Deluxe
Room 215
Guest requested a wake-up call.
Suite
Occupancy Overview
7,971,421
2%
Current guest status.
Checked-In
Checked-Out
Pending
Check-In Guest
Booking Distribution
Daily
Weekly
Monthly
781,224
Total Bookings
Standard Room
Suite Room
See Full Report